Measure Every Trade. On Every Exchange.

cryptooracle today launched Trading Statistics, a full performance analytics dashboard for every bot running on the platform – plus native support for two new exchanges, Kraken and Hyperliquid.
Know your edge, in numbers
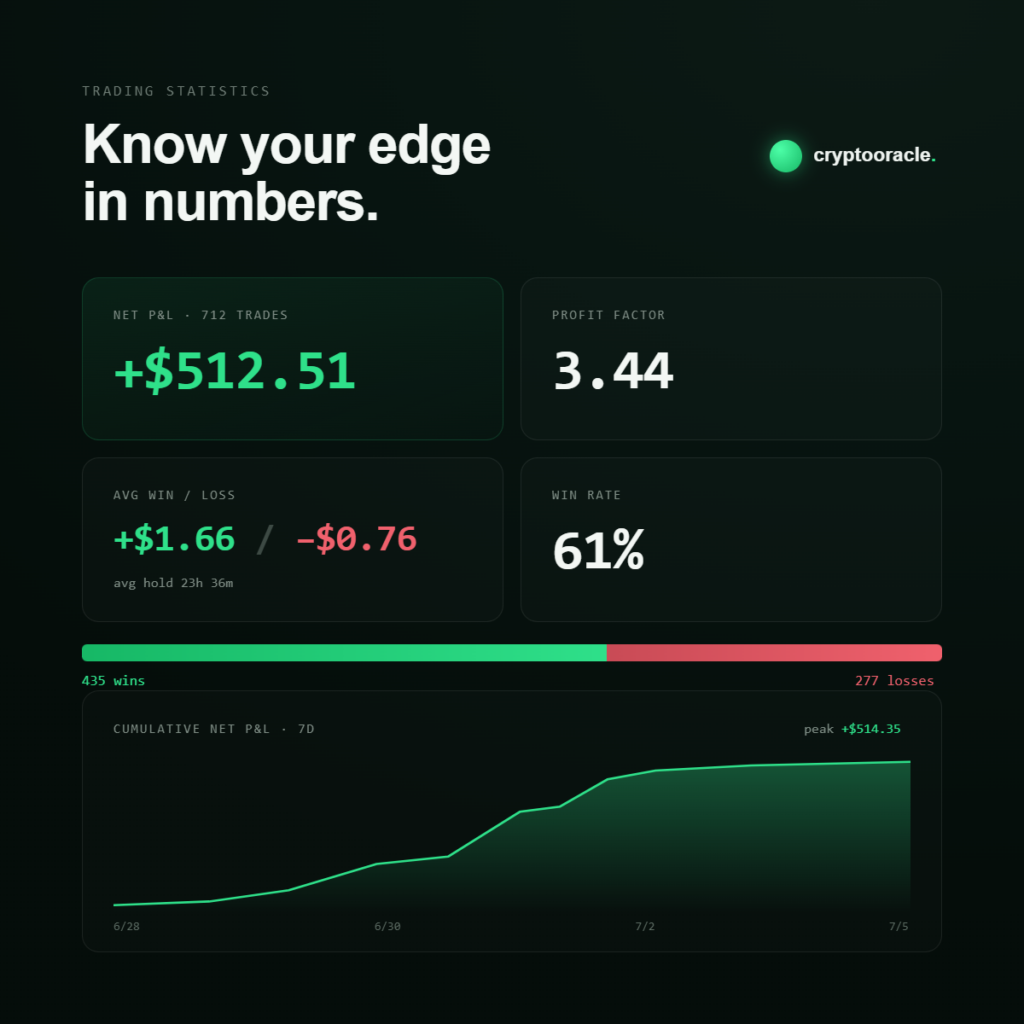
Trading Statistics turns raw fill history into a real performance record. For any account, cryptooracle now surfaces:
- Performance overview – net P&L, win rate, profit factor, and total trade count at a glance.
- Cumulative equity curve – a live chart of net P&L over time, with peak, trough, and max-drawdown markers.
- Win/loss breakdown – wins vs. losses, average win vs. average loss, and average hold time.
- P&L by symbol and by exit path – see exactly which assets and which exit conditions (stop-loss, partial close, hedge close) are driving results.
- Long vs. short direction breakdown – separate performance for each side of the book.
- Per-asset / per-exchange rollup – turnover, median leverage, and annualized APR, broken out by asset and by exchange.
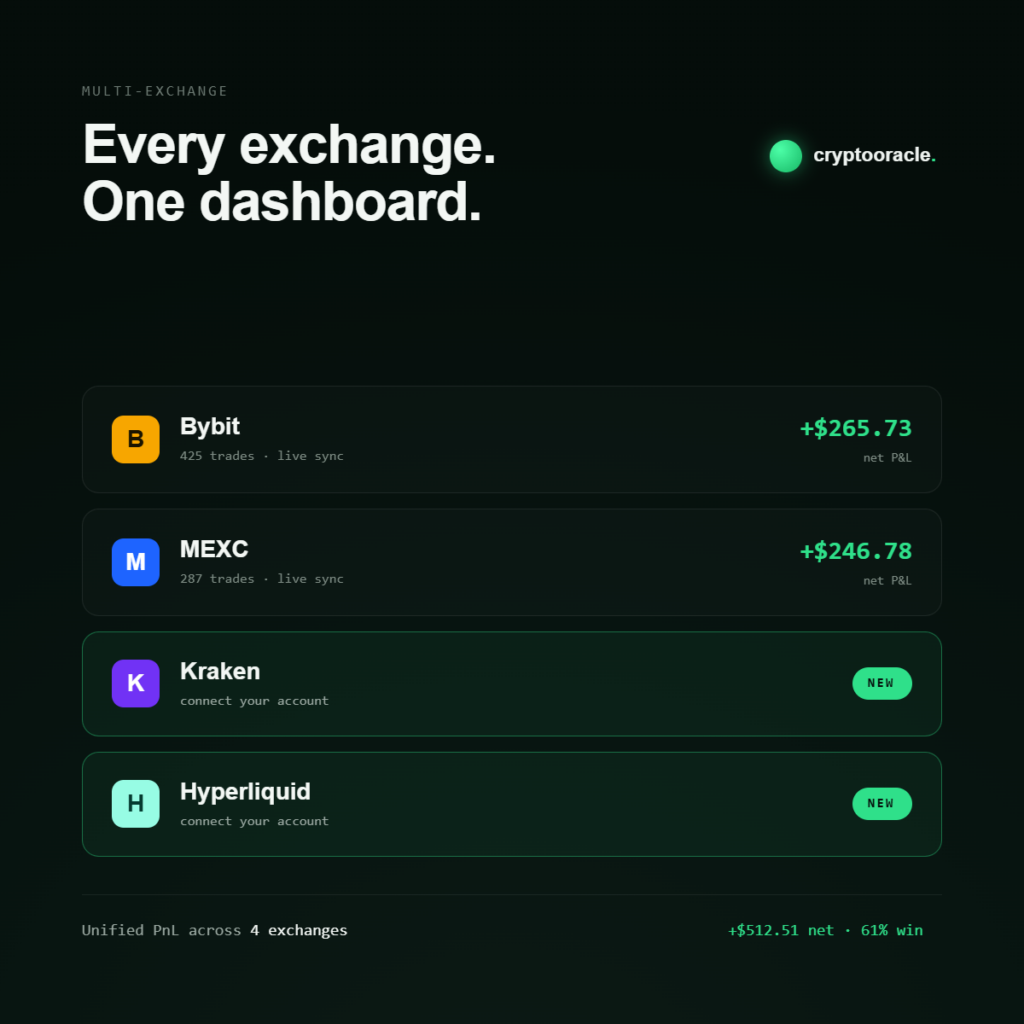
Now covering every exchange – including two new ones
- Kraken – connect your account and Trading Statistics starts tracking it immediately.
- Hyperliquid – full analytics support, alongside this week’s hedge-mode trading support.
Combined with existing Bybit and MEXC support, cryptooracle is now the only place to see unified P&L across all four exchanges in a single dashboard.
Available now
Trading Statistics is live today for all cryptooracle users. Connect Kraken or Hyperliquid from Settings to start tracking those accounts alongside your existing exchanges.