The hedge that feels fine, and the arithmetic that says otherwise
Datapipesoft today released two connected additions to CryptoOracle: a partial-exit economics panel that computes the real per-cycle result of a recovery setting as the trader types it, and a position risk score that turns a hedged book into one number, a zone, and a specific instruction. Both are live across Bybit, MEXC, Hyperliquid, Kraken and Capital.com.
The problem with a hedge that is working
In CryptoOracle’s partial-close mode, a hedged position digs itself out gradually: the winning leg books a locked-in gain, and the bot deliberately closes a slice of the losing leg against it. For every dollar of loss retired, the trader chooses how many dollars of profit to spend doing it — the partial exit profit rate.
Set it well and the book grinds its way back. Set it slightly wrong and something worse than a loss happens: the cycle keeps running, the screen keeps showing green harvests, and the account goes nowhere — because taker fees on both closed legs quietly consume the difference. Nothing about that failure looks like a failure. It looks like activity.
What one cycle really pays
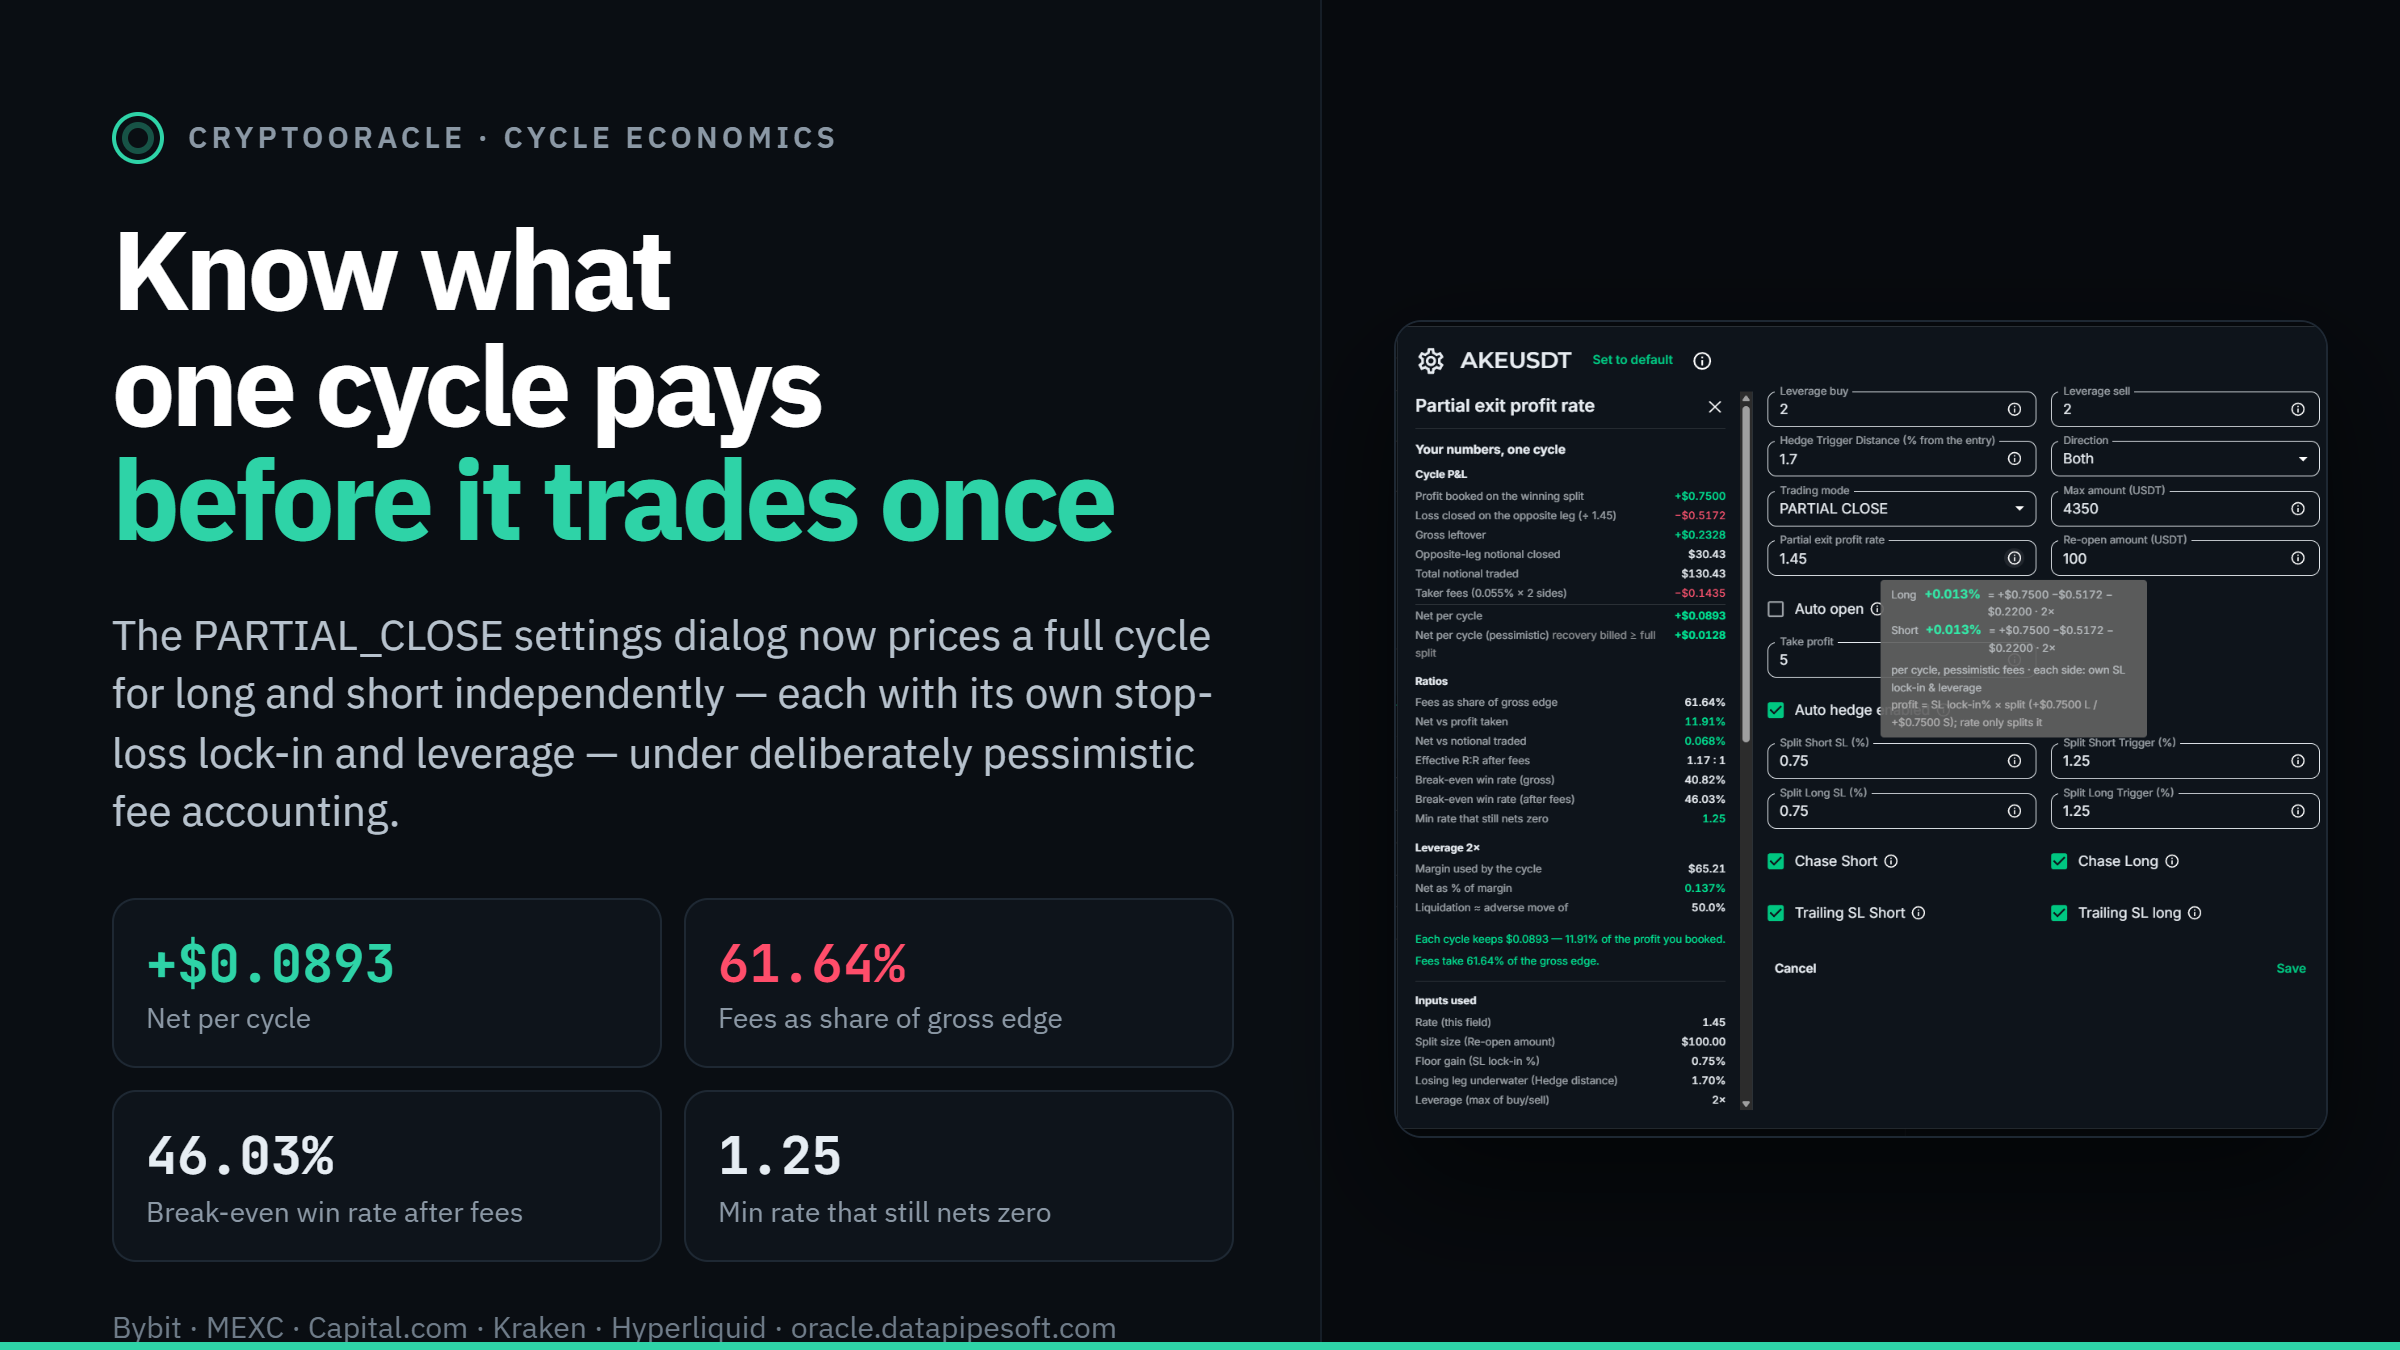
The panel runs the full cycle arithmetic against the values currently in the form and updates as they change. It uses the conservative reading throughout — the guaranteed floor of the trailing stop, not its best case — so the number shown is the one the trader can count on.
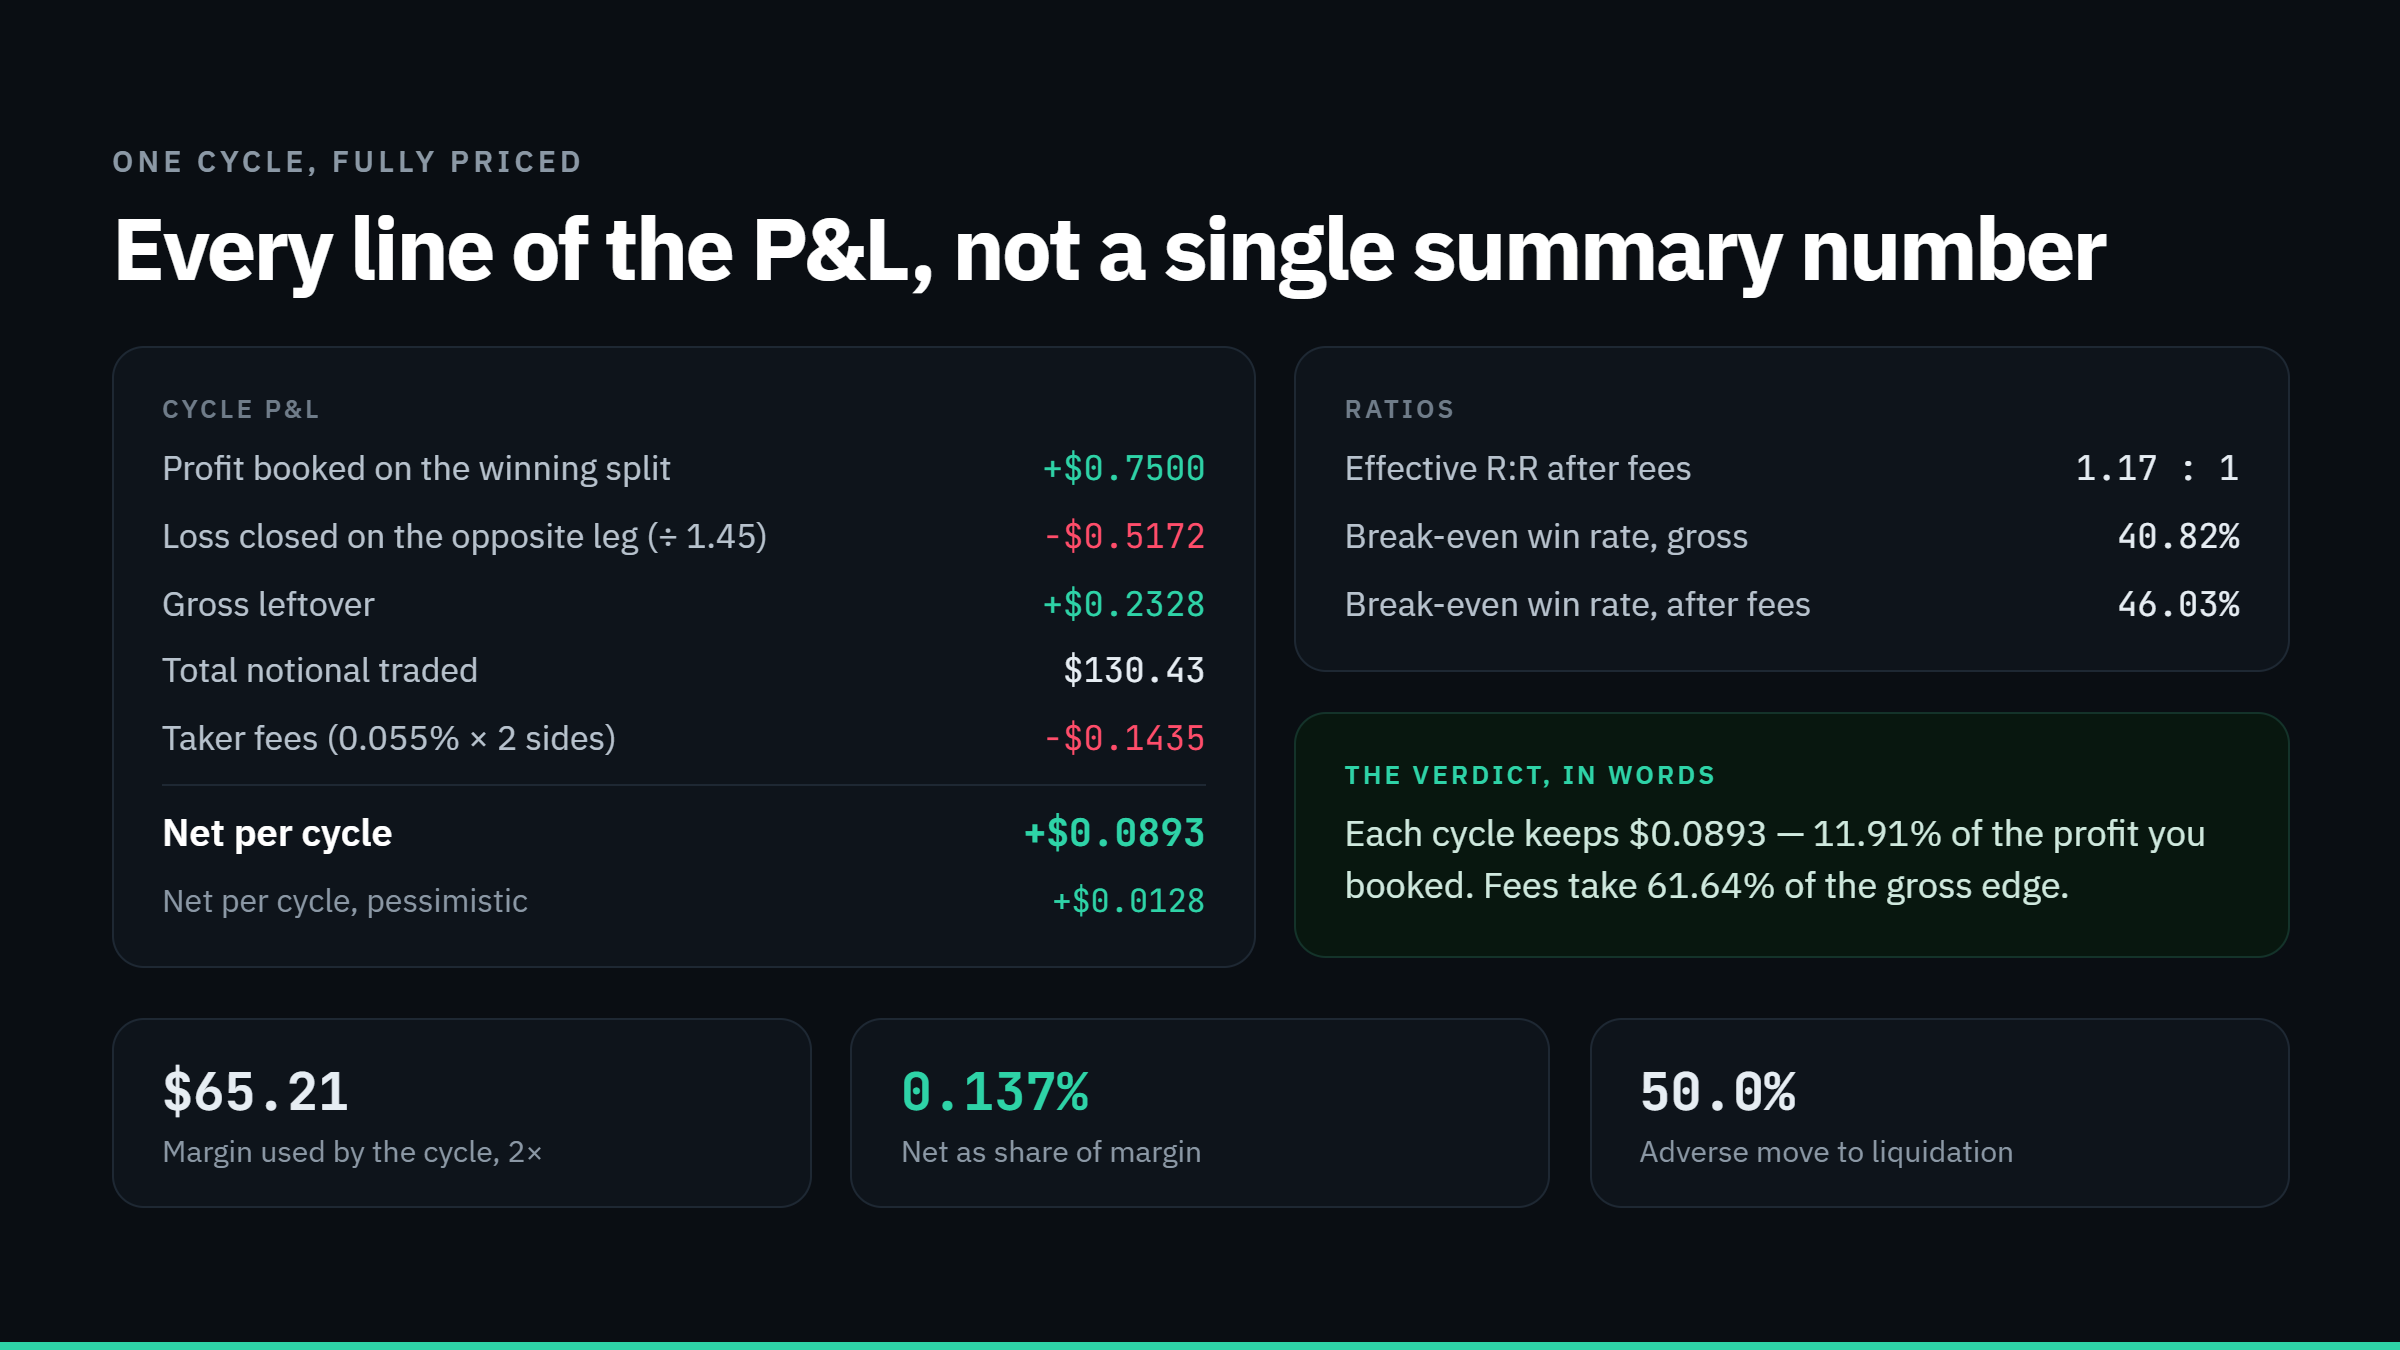
On the configuration shown — rate 1.45, a $100 split, a 0.75% stop lock-in, a leg 1.70% underwater at 2× — the cycle books +$0.7500, retires $0.5172 of loss, pays $0.1435 in taker fees and nets +$0.0893. Fees take 61.64% of the gross edge. The cycle keeps 11.91% of the profit it booked.
And the figure the panel exists for: the lowest rate that still nets zero at this geometry is 1.25. A setting of 1.45 is not comfortably profitable — it is 0.20 away from pointless. A rate is never good or bad on its own; it is good or bad relative to the lock-in percentage, the hedge distance and the fee schedule around it. The panel states the break-even outright rather than leaving it to be discovered over a month of cycles.
The pessimistic column
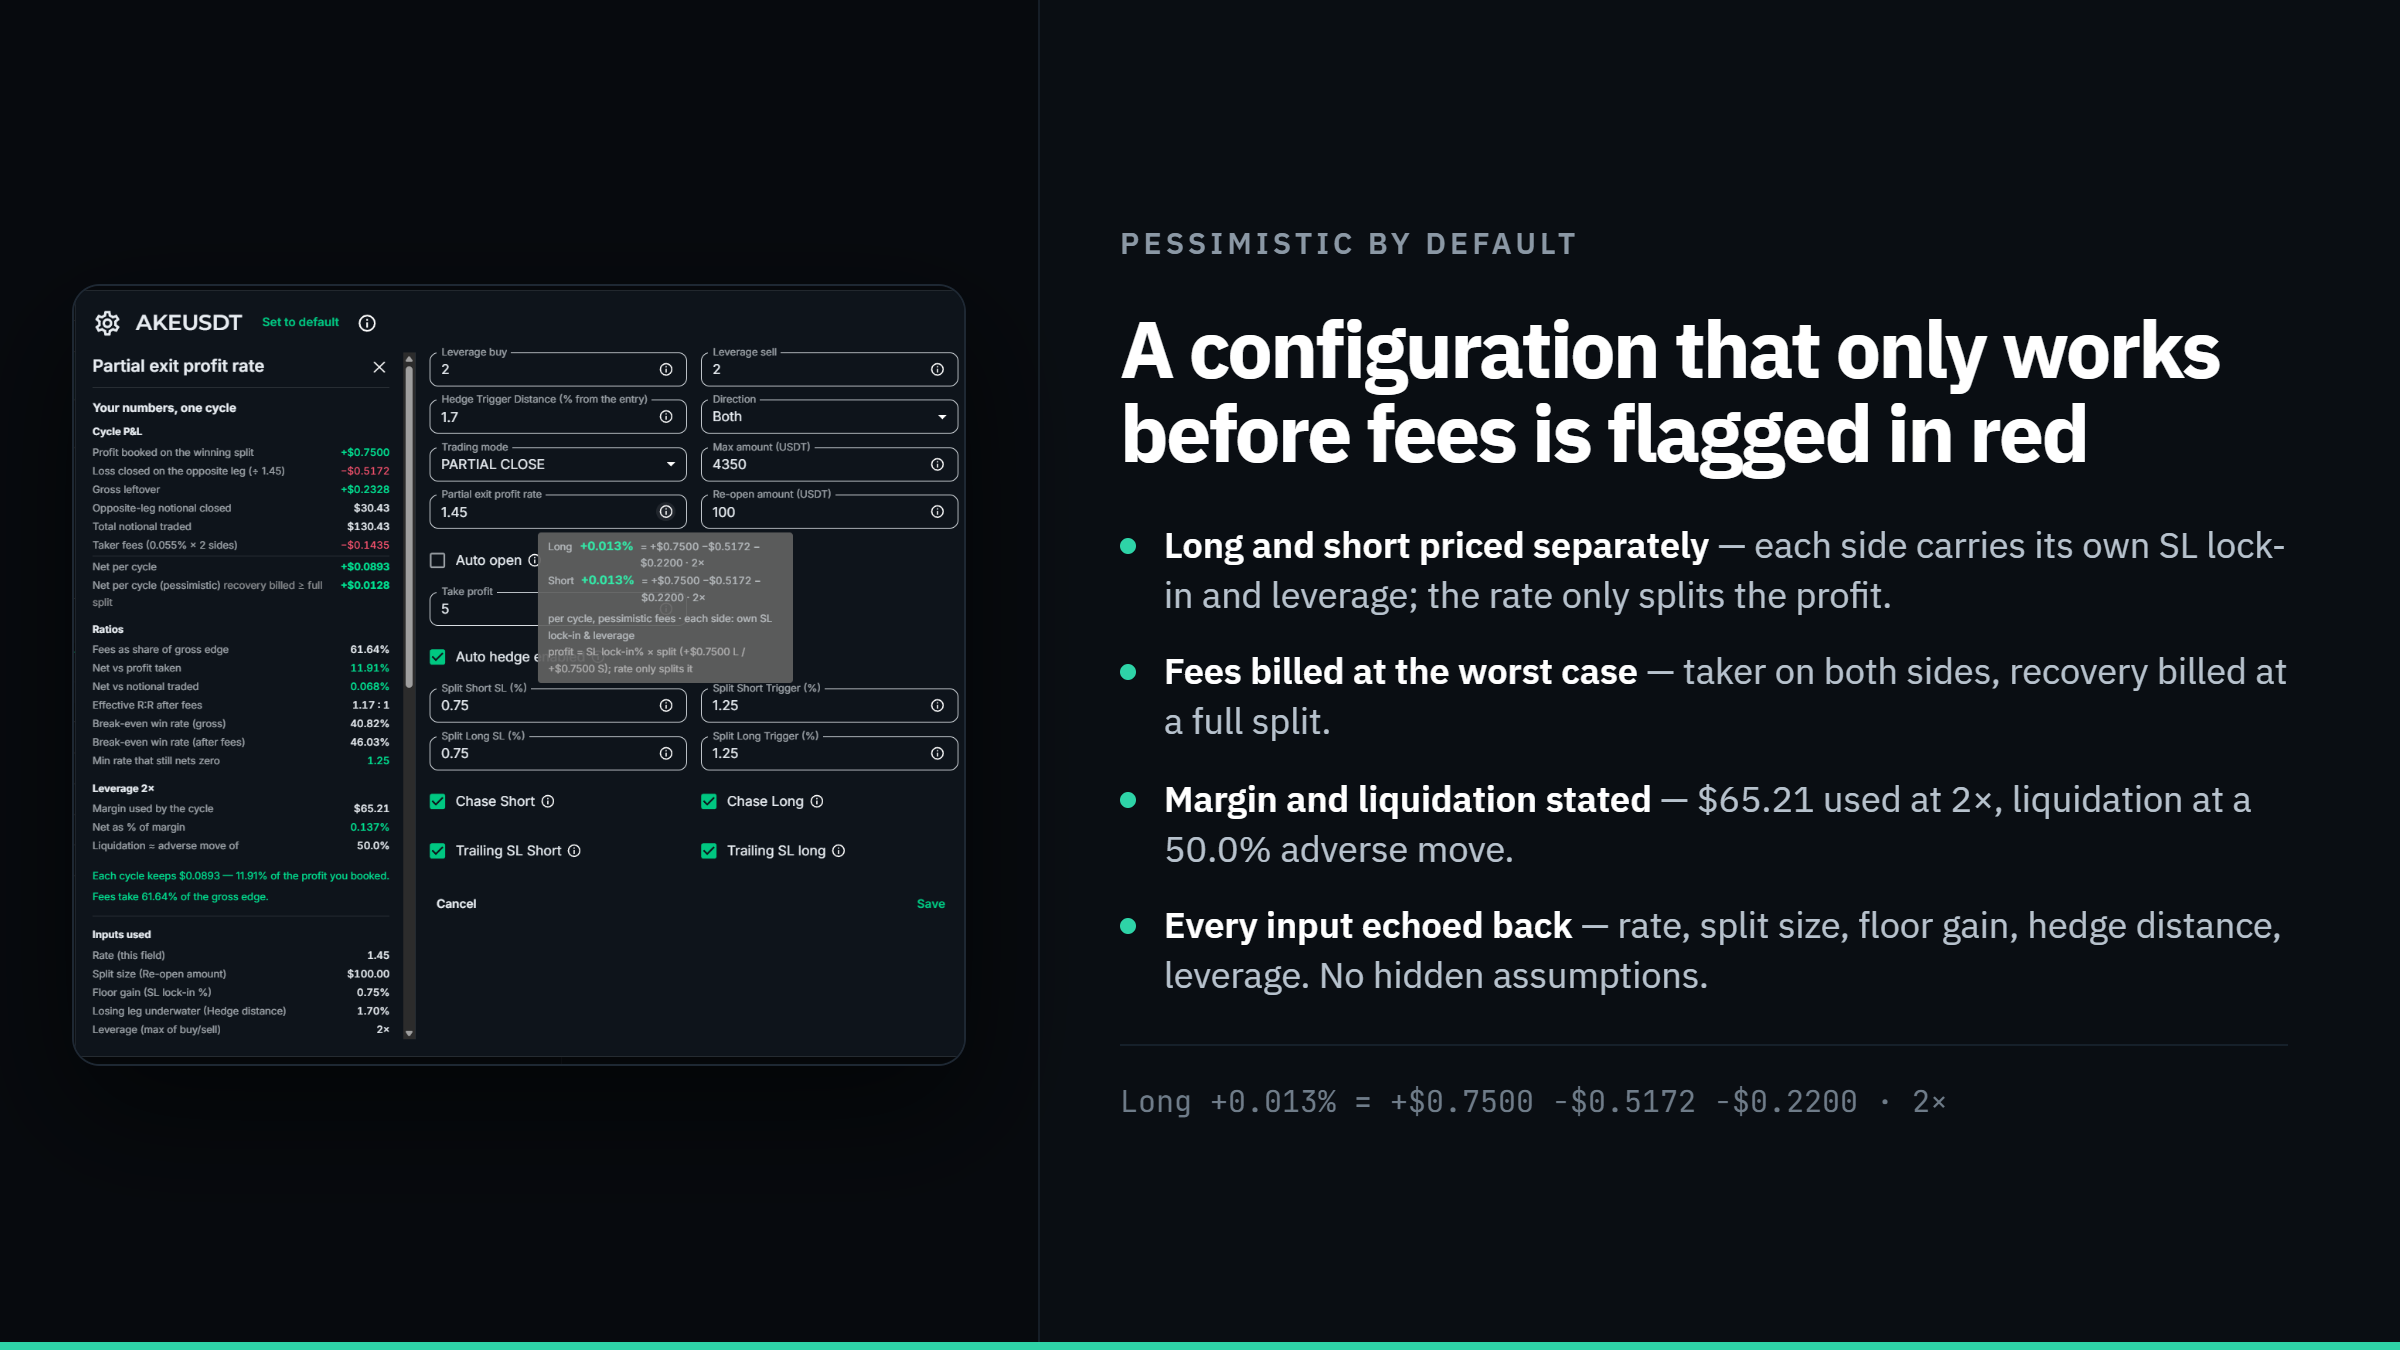
Alongside every result sits a second, worse one. When the losing leg is only barely underwater, retiring a dollar of loss means closing a large notional — and the fee model bills the recovery leg at no less than a full split’s round trip. On the configuration above, that takes the net from +$0.0893 down to +$0.0128.
Showing both was deliberate. A tool that reports only the favourable case teaches its user to trust it, right up until the case that matters.
Risk score X: one number, and what is binding it
The second addition asks a different question — not “does a cycle pay?” but “can this position still be recovered at all?” Every symbol is scored on four independent readings, each expressed as a fraction of its own limit. The score is the worst of the four, and the report names which one is binding, because that is the only one worth acting on.
| Component | What it reads | Default limit |
|---|---|---|
| Concentration | The symbol’s initial margin as a share of exchange equity | 10% of equity |
| Recoverability | How many full-book harvest cycles it would take to digest the losing leg at the current rate and trigger | 20 cycles |
| Ruin distance | Distance to liquidation measured in units of the symbol’s worst hourly range over the past week | 3× that range |
| Carried loss | Unrealized book loss as a share of equity | 1% of equity |
Recoverability names the thing traders feel but rarely quantify. A leg that needs eighty cycles to clear is not a position being managed; it is a position waiting on a reversal — and the score says so in a unit, cycles, that maps directly onto how long that would take.
Four zones
Trade freely below 0.7 · No new adds from 0.7 · Reduce from 1.0 · Close at 2.0 and above. Because 1.0 is the point where a limit is exactly reached, the zones are read against that anchor rather than an arbitrary scale.
And then it tells you the size of the cut
Where the binding component is recoverability or carried loss, the report does not stop at a diagnosis. It prescribes: which leg to cut, what fraction of it, the resulting size, and the dollar cost of doing it now.
In the example above, SNDKUSDT scores 10.82 — recoverability binding, deep in the close zone — and the suggested action is explicit: close 95% of the Sell leg at market, realizing −$168.75 now. The cost line matters as much as the fraction. Taking the cut is a real, immediate loss, and the trader is shown that price rather than being nudged into it.
The target is stated rather than aesthetic: cut the losing leg back until it needs no more than ten harvest cycles to clear, or until the carried loss is under half a percent of equity — whichever demands more.
- Reports, not orders. The score is computed on demand and never places a trade. The decision to cut stays with the trader.
- Honest about missing inputs. A component with no liquidation price or no candle history returns no value and says why, instead of scoring an unknown as safe.
- Tunable per trader. Every limit and zone boundary can be overridden per account; the defaults are a starting point, not a doctrine.
Calibrated on a real loss
The default limits are not theoretical. They are drawn from the post-mortem of a specific position in our own trading whose recovery arithmetic had stopped working well before it became obvious, and the calibration is pinned in the test suite so it cannot drift silently. The score exists to make that particular failure legible early, in a number, on every symbol.
Availability
Both features are live for CryptoOracle subscribers. The economics panel appears in the settings dialog for every symbol in partial-close mode, priced per side. Risk reports are available on demand per symbol, or across the book from the risk monitor, on Bybit, MEXC, Hyperliquid, Kraken and Capital.com.
Companion release: Pending Entries — conditional opens that trade with the trend.
“The dangerous position is never the one that looks bad. It is the one that looks busy — harvesting, hedging, closing, all of it working exactly as designed, while the arithmetic underneath has quietly stopped adding up. We wanted the platform to say that out loud, with a number and a size, before the market says it for us.”
[SPOKESPERSON NAME, TITLE], Datapipesoft